The 2026 Childhood Cancer Report
From diagnosis to research: measuring momentum in the search for cures
The Burden of Childhood Cancer in the U.S.
Childhood cancer is a group of diseases in which abnormal cells grow out of control in children and adolescents ages 0-19. It is not just one disease, but dozens of different types. While many tumors are malignant, some tumors in children may be non-malignant but still require oncology treatment. The data in this section shows a holistic overview of childhood cancer. Further ahead, read more about the data around individual disease types (leukemia, neuroblastoma, brain tumors, etc.), as well as the key milestones in research and treatments in Section 2 of this report.
Key Facts:5
- Approximately 15,000 children are diagnosed with cancer each year in the United States.
- About 1 in 274 children will be diagnosed with childhood cancer by age 20.
- Childhood cancer is the leading cause of death by disease in the United States.
- While incidence rates of childhood cancer are increasing, less children are dying of cancer.
- There are over 500,000 survivors of childhood cancer in the United States.6
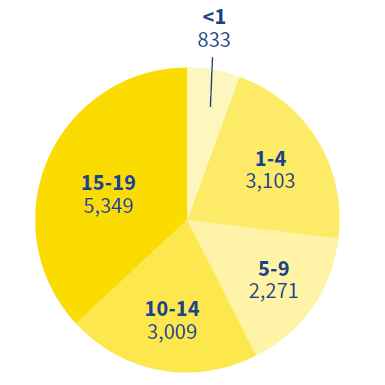
Cases of Childhood Cancer in the United States
by Age, 20237
Age-Adjusted Incidence Rates9
Age-adjusted incidence rates help us understand the risk of cancer in a population by taking age differences into account. For example, a location with more children might appear to have higher rates of childhood cancer because there are more kids, not necessarily because the disease is more common there.
By adjusting for age, experts can make more accurate comparisons between different places or time periods and see whether the actual risk of cancer is truly going up or staying the same.
Age-Adjusted Incidence Rates 1975-2023, United States
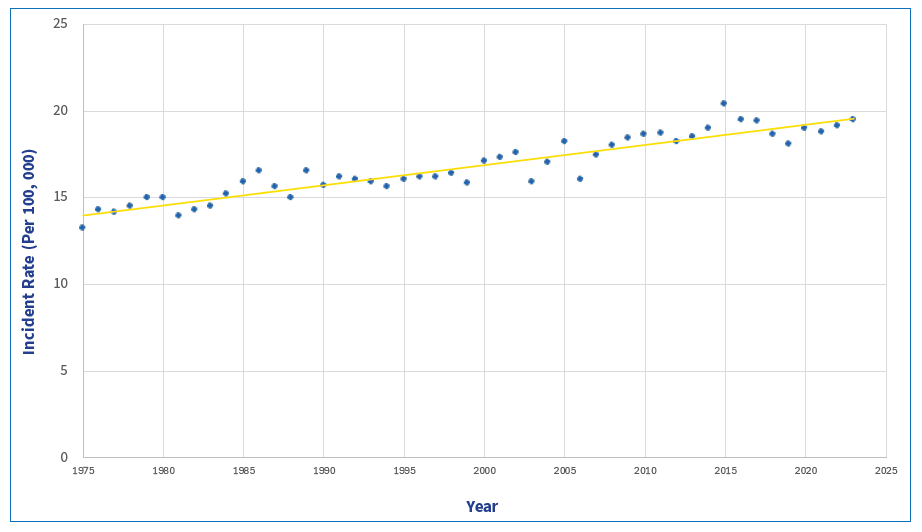
Incident rates have been increasing since 1975. Jump ahead to Incidence Rates and Causation for more information.
Mortality Rates
The graph below shows the decline in mortality rates since 1975, thanks to better treatments. In 2024, the most recent year for which mortality data is available, 1,801 children died from cancer.10
In the United States, mortality rates are tracked by the National Vital Statistics System, which captures information about every death from all cause from every county in the United States. Mortality data is shared with SEER and reviewed on a different cycle than the incidence data, which is reviewed and collated by cancer registrars. As a result, the timeline for reporting varies due to different agencies managing the data.
Mortality Rates 1975-2024, United States11
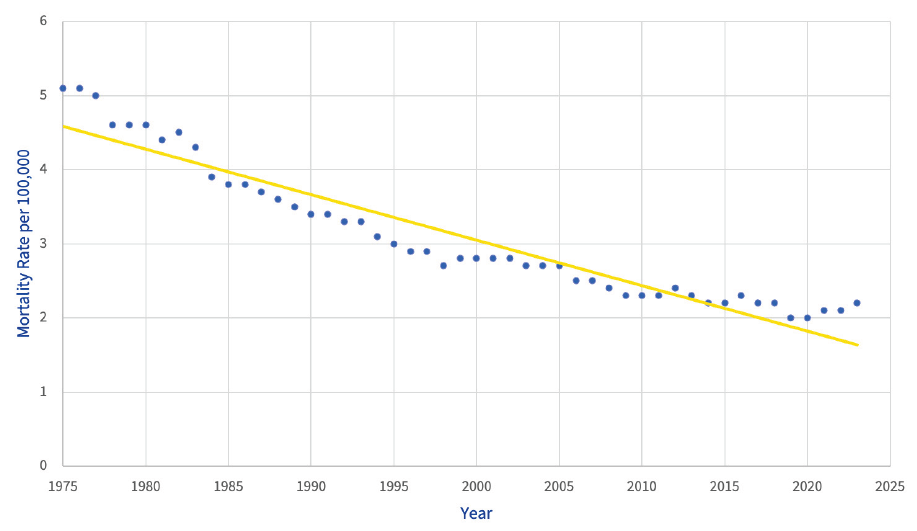
Cancer mortality rates, which had been steadily declining for decades, showed a slight increase around 2020–2021 for both children and adults. While no single cause has been definitively established, researchers largely attribute this shift to the direct and indirect effects of the COVID-19 pandemic. These included disruptions to healthcare services, delays in cancer screening and diagnosis, interruptions in treatment, and increased vulnerability among patients with cancer. Together, these factors may have contributed to worse outcomes during this period.12

The average age at diagnosis for childhood cancer is 8 years old. For adult cancers, that age is 67. 8

Demographics of Childhood Cancer
Childhood cancer registrars who maintain and review reported cases of childhood cancer track more than just the diagnosis. They track age, ethnicity, geographic location, and first primary treatment. This data gives valuable insights to oncology researchers as they try to understand the complexities of cancer, and also to researchers who are tracking treatment disparities, cancer clusters (areas with an increased number of cases), and other demographic indicators. For a more in-depth discussion on the demographics of childhood cancer, see Section 3.